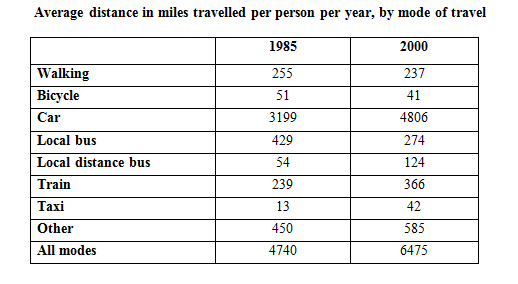
The given table depicts the changes in different modes of transportation in England during the years 1985 and 2000, and is described in average distance travelled per person per year in miles. Overall, there appears to be a considerable increase in total average distance travelled by means of all modes of transport, with car being the main mode of travel, and bicycle and taxi being the least preferred.
Firstly, a positive trend is noticed in most of the modes of travel, with the total average distance increasing from around 4750 miles to just under 6500 miles. Travelling by car recorded a staggering increase from around 3200 to more than 4800 miles, followed by 'other' modes which recorded a rise from 450 miles to just under 600 miles. Long distance bus, train and taxi too saw a swell from 54 to 125, 289 to 366 and 13 to 42 miles respectively.
On the other hand, there was a negative trend in travelling by walk, bicycle and the local bus. The distance travelled by walking and by bicycle fell modestly during the course of fifteen years. However, local bus travel witnessed a drastic drop from 429 to 274 miles.