Task 1 Bar chart
Posted: Wed Jul 09, 2014 4:36 am
The chart below shows information about the challenges people face when they go to live in other countries.
Summarise the information by selecting and reporting the main features, and make comparisons where relevant.

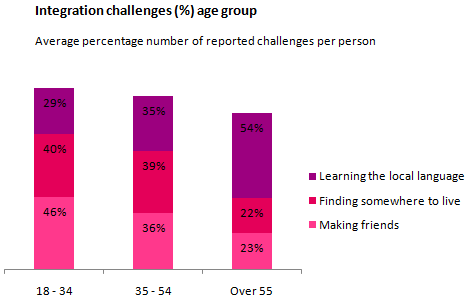
The bar chart compares the percentage of challenges people have to face when they moved to new countries. The people's attendance is divided into three aged groups.
It is clear that the young people from 18 to 34 has more difficult than two other groups. It is also noticeable that the figures for type of the most challenging of three groups tend to be differently.
Making friends is the most challenging aspect for the youngest group with 46%. This figure are exactly twice as high as the oldest group over 55 years old, while 36% of 35-54 aged people find it hard to have new relationships. Again, the rate of percentages show similarly on finding new place to live. The proportion of people who have problems making friends and finding somewhere to live by around 40% for two younger groups almost doubling the ratio of oldest group with just only 22@.
On the other hand, 54% of oldest group recorded learning new languages the biggest trouble when migrating, whereas the youngest people easily to learn new languages with the lower proportion, at only 29%.
Summarise the information by selecting and reporting the main features, and make comparisons where relevant.

The bar chart compares the percentage of challenges people have to face when they moved to new countries. The people's attendance is divided into three aged groups.
It is clear that the young people from 18 to 34 has more difficult than two other groups. It is also noticeable that the figures for type of the most challenging of three groups tend to be differently.
Making friends is the most challenging aspect for the youngest group with 46%. This figure are exactly twice as high as the oldest group over 55 years old, while 36% of 35-54 aged people find it hard to have new relationships. Again, the rate of percentages show similarly on finding new place to live. The proportion of people who have problems making friends and finding somewhere to live by around 40% for two younger groups almost doubling the ratio of oldest group with just only 22@.
On the other hand, 54% of oldest group recorded learning new languages the biggest trouble when migrating, whereas the youngest people easily to learn new languages with the lower proportion, at only 29%.